Effective project and portfolio management relies on actionable, data-driven insights to drive work forward.
Learn more about portfolio reporting with BrightWork for SharePoint On-Premises [Free video]
Easy access to project data allows teams to collect, measure, interpret, and analyze project performance in meaningful ways.
However, with so much information circulating in different channels, turning data into insight is often tricky.
Project managers waste too much time collecting data whilst senior executives are often waiting for reports – with varying degrees of quality and timeliness.
In this article, I’ll show you how BrightWork Reporter, a key feature of our PPM solution for SharePoint, can help you to create powerful project reports. You’ll learn how to configure reports to focus on what you need and see how to create Shared Reports for the team.
What is BrightWork Reporter?
BrightWork Reporter is a highly configurable web part, used to report on multiple sites, subsites, and lists in a single report.
This diagram shows the structure of a typical BrightWork site collection.
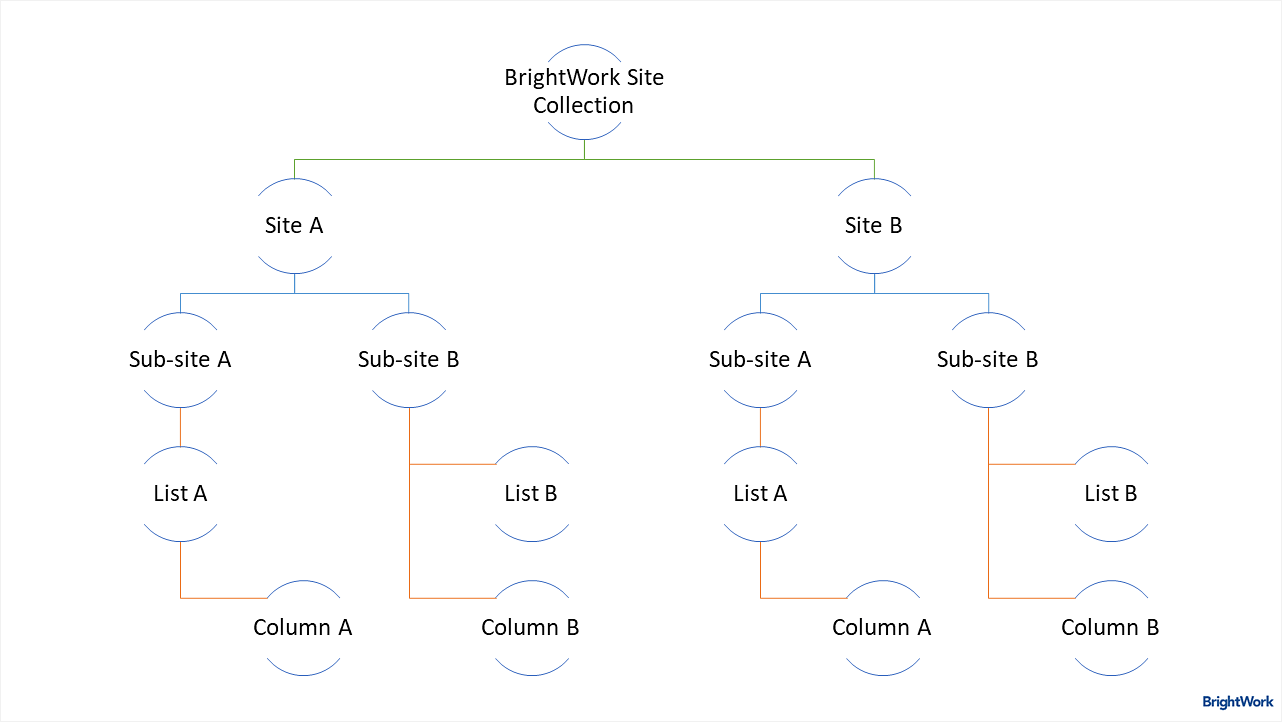
Instead of manually checking each project site for information, you can use BrightWork Reporter to pull information together into a single report.
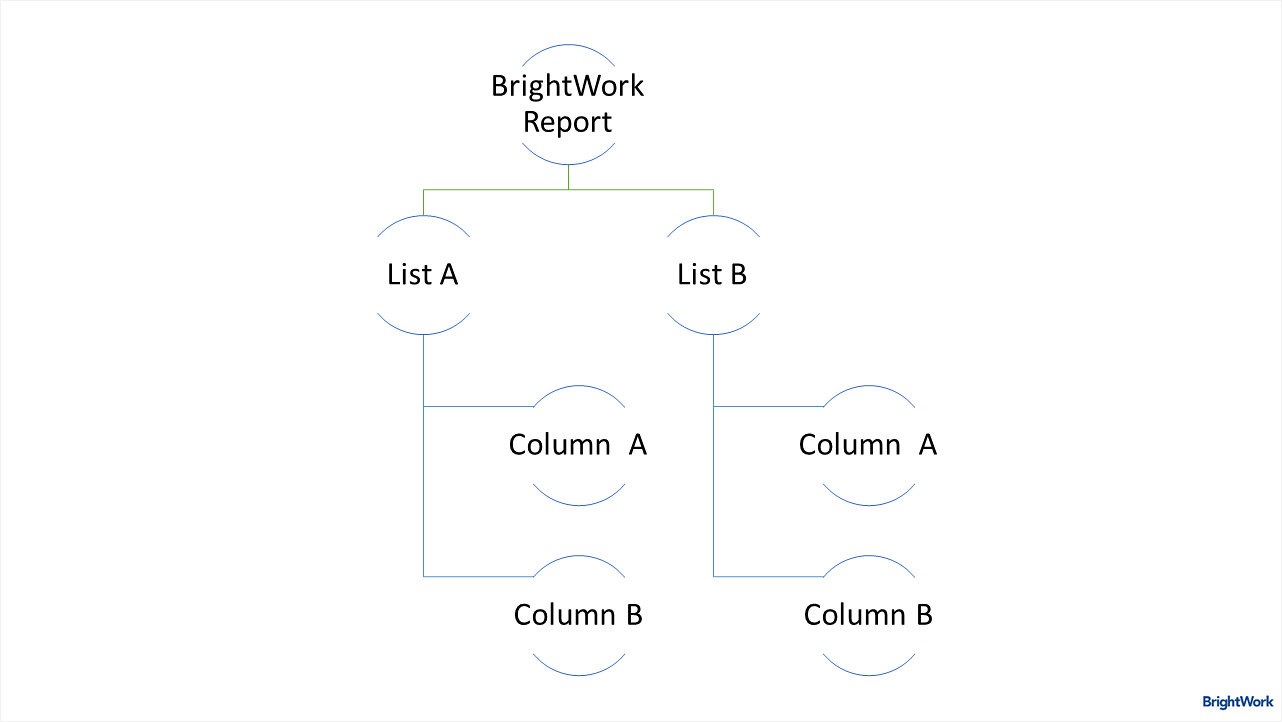
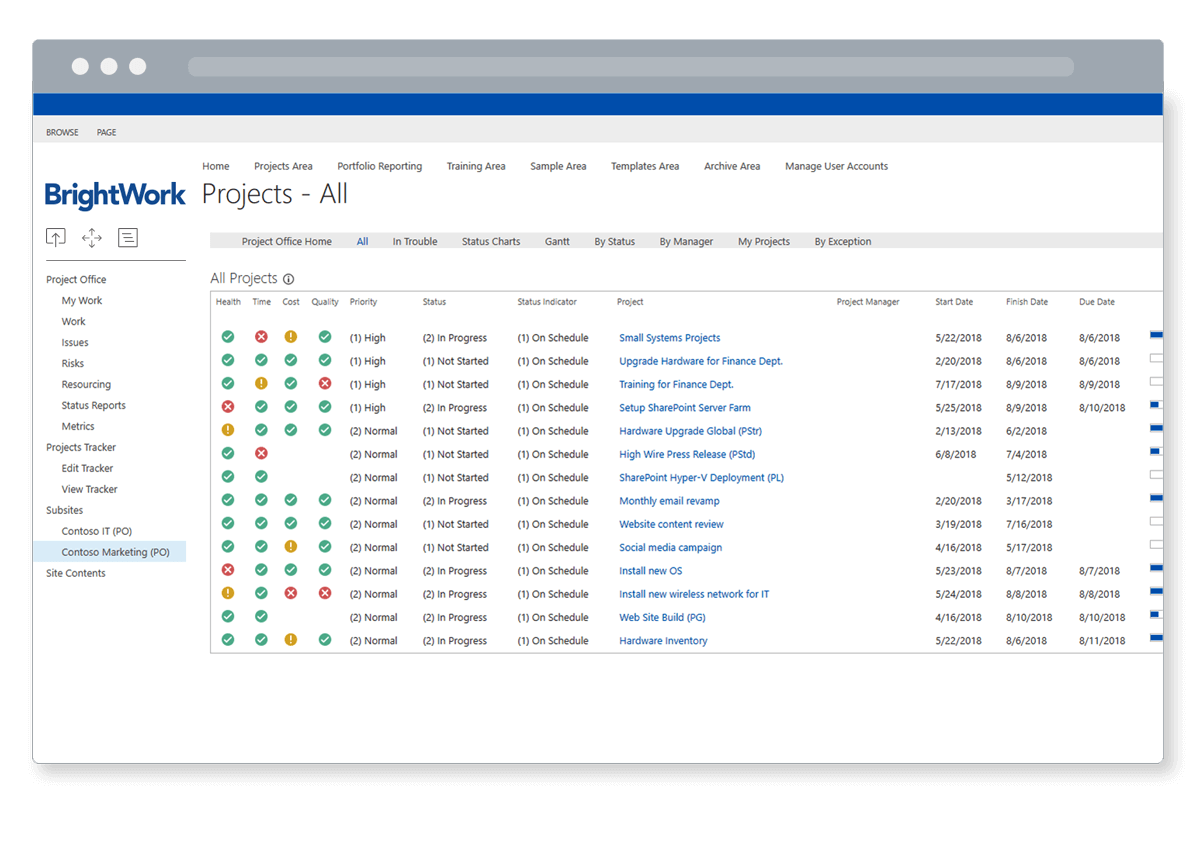
Below is an example of various multiple sites, subsites, and lists rendering as a single report.
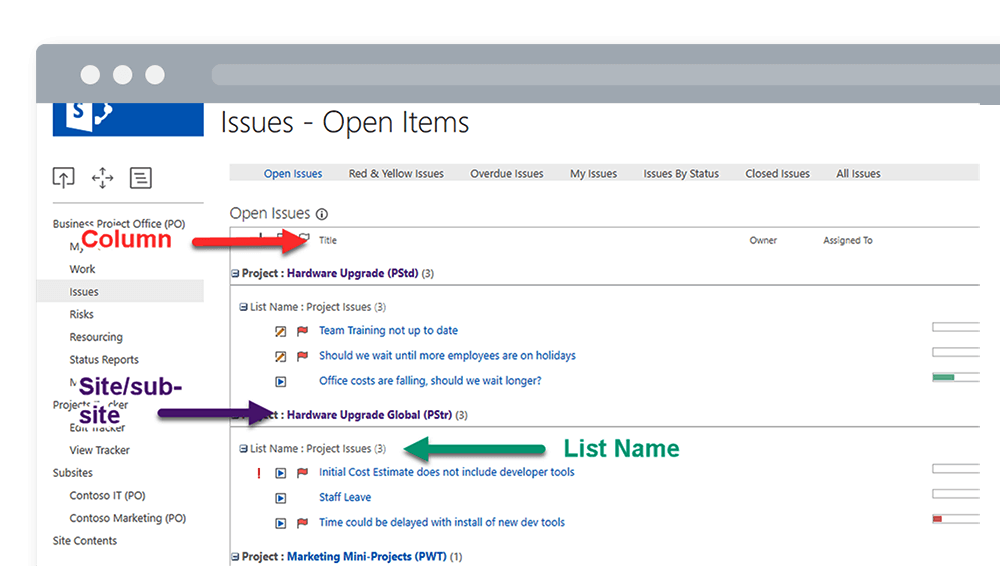
Using BrightWork Reporter, you can:
- Create personal and shared reports.
- Filter and sort data.
- Create cross-list and cross-site report filters.
- Render data as a chart, Gantt chart, list item report, or Resource Usage report.
- Share reports via email.
Read more about sharing emailed reports using BrightWork Reporter in this article.
Navigating BrightWork Reporter
Before we take a closer look at using BrightWork reporter, let’s run through the navigation options – the Reporter Ribbon and the Information icon (i).
1. The Reporter Ribbon

Using the Reporter Ribbon, it’s easy to:
- Toggle between Shared and Personal Reports.
- Personalize your reports.
- Display report information, such as data source and active filters.
- Share reports with the project team.
- Access ‘Configure Reporter Settings’ for shared reports.
- Show groupings and totals.
2. Report Information Icon
The Report Information icon is located in report web parts, such as lists and Gantt charts. Simply click the icon to access key information about the report.
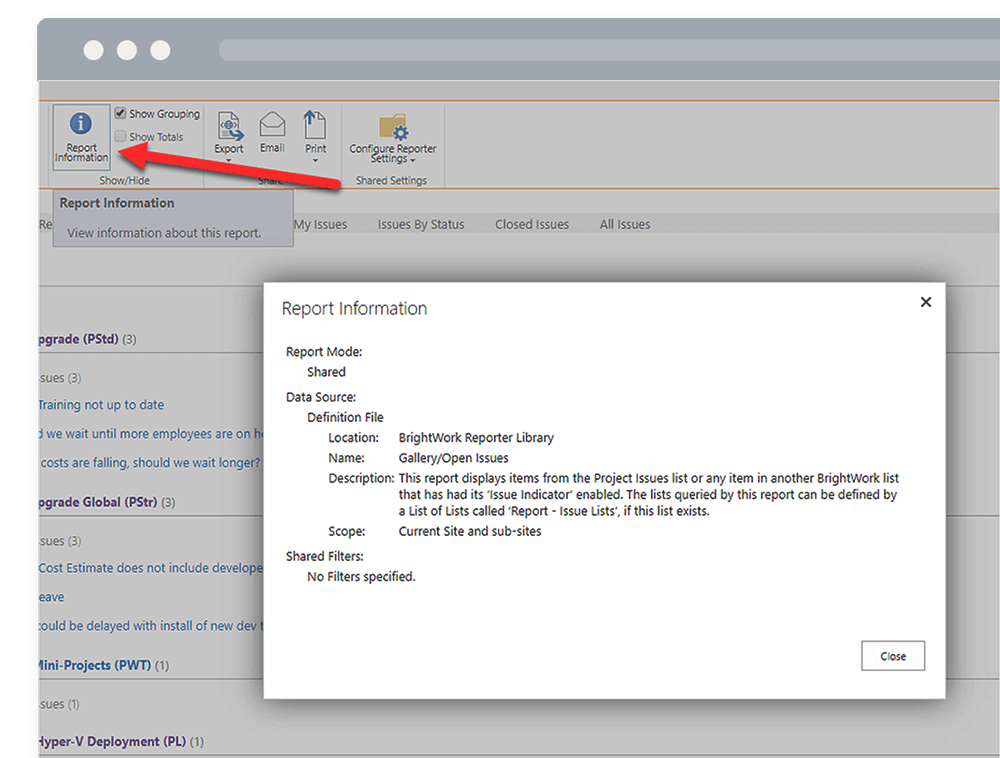
This data is also accessible by clicking the information icon (i) beside each report.
Below, we’ll take a closer look at using BrightWork Reporter, starting with key configuration options.
BrightWork Reporter Configuration Options
Using options in the ‘Personalize this Report‘ area in the Reporter Ribbon, you can:
- Filter data
- Sort data
- Group data
- Add Totals
- Add or remove columns.
Use these options to find the information you need quickly.
1. Filter
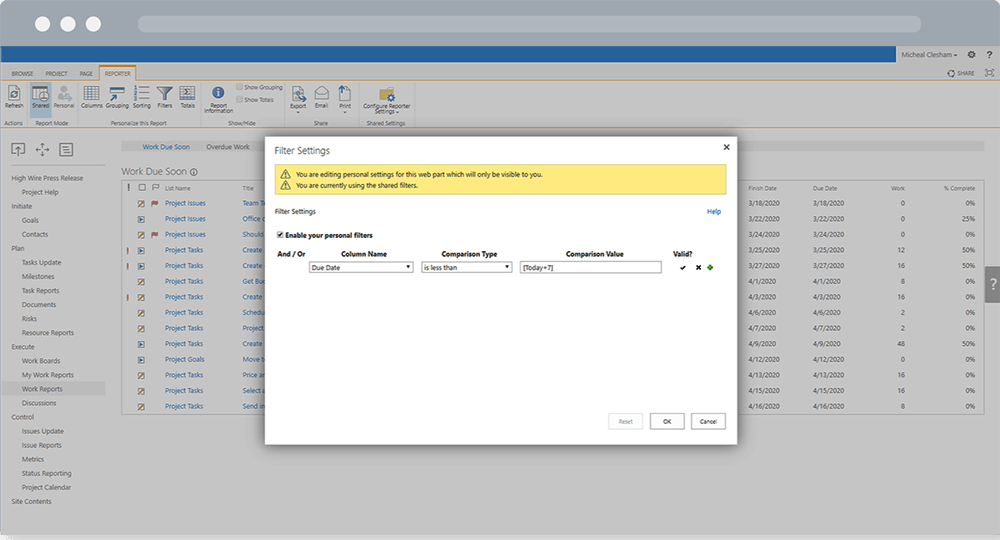
Project reports can often contain too much information, making it hard to spot problems. Filtering reduces the original dataset to key items you need to see, for example, ‘current projects by project manager’.
The filter is very similar to a SharePoint list view filter.
Click ‘Filters’ in the Reporter Ribbon to view the various filter options.
2. Sort
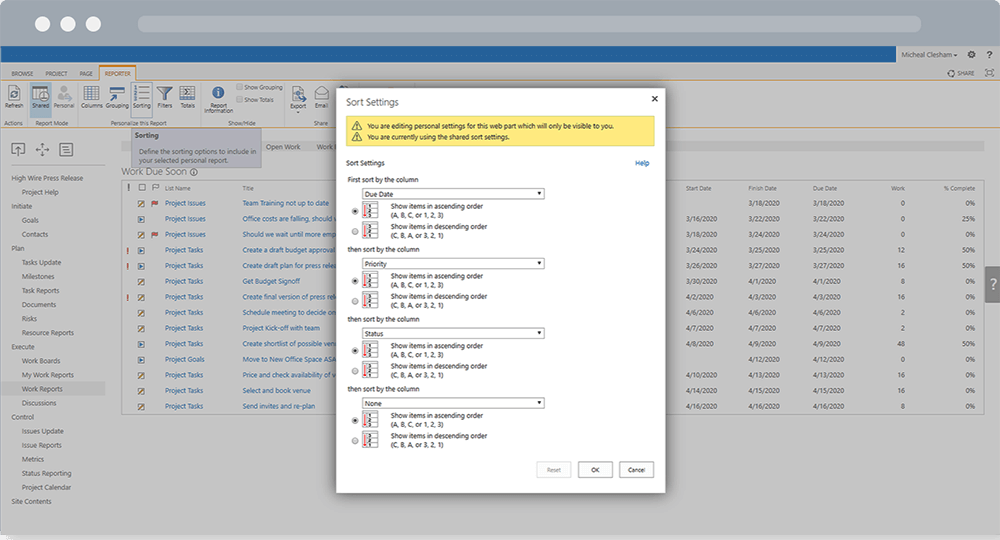
Sorting data alphabetically, numerically or chronologically is available in the List Item and Resource Reports.
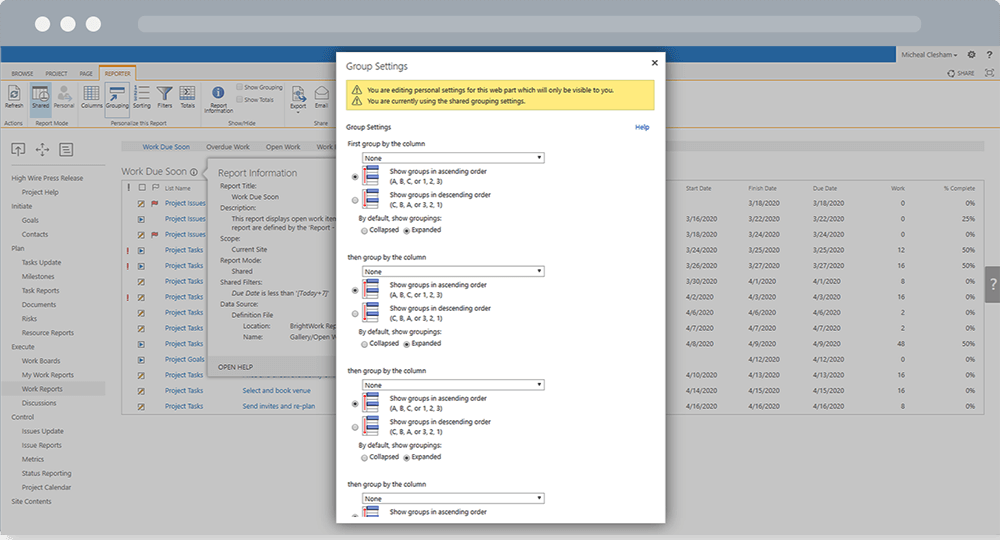
3. Grouping
Various options are available to group information together in a logical way for a project.
Note – you can also choose to display data as ‘Collapsed’ or ‘Expanded’.
4. Totals
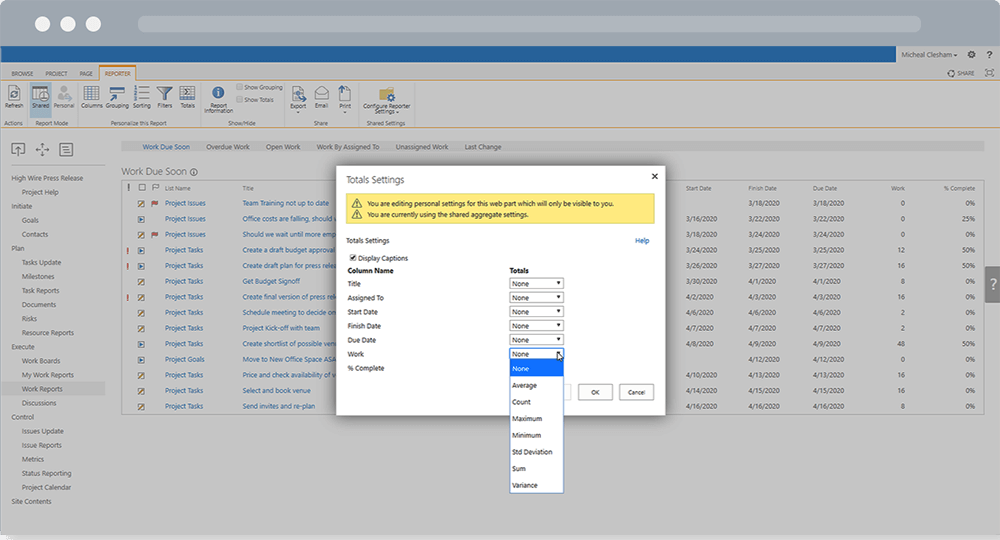
BrightWork Reporter performs the same totaling functions as a standard SharePoint view.
The display options depend on the column, for example, you can use ‘Minimum’ for numbers, currency, and date/time columns.
5. Columns
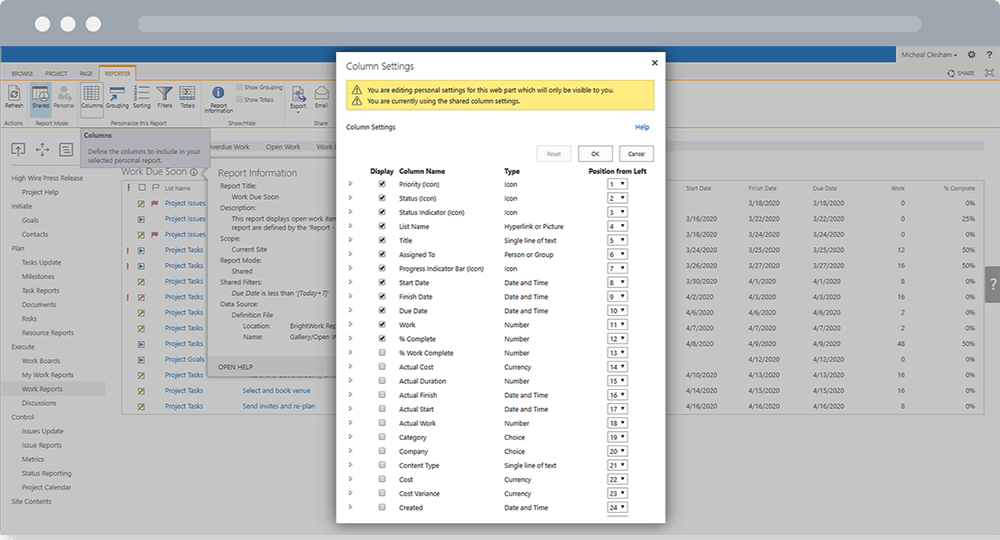
In addition to adding or removing columns in a report, you can also re-arrange the order of columns in a report.
Now that you understand how to configure a report in BrightWork, it’s time to apply these options to Personal and Shared Reports.
Personal Reports
BrightWork Reporter allows users to create their own personal report, which becomes the default report upon login.
Follow the same configuration options as outlined above. The end result is only available to you.
As you work through the various options, you’ll see a message at the top of the dialog box, highlighted in yellow. When editing a Shared Report, this box is highlighted as grey – an easy way to remember where you are!
A caveat – if you are in a meeting with your team or stakeholders, it’s best to use the ‘Shared’ Reports view. Otherwise, everyone will be talking about different information.
Shared Reports
Depending on your SharePoint permissions, you can configure reports available to all team members and stakeholders. This feature is especially useful for PMO managers, making it easy to implement standardized reports throughout your organization.
The ‘Shared Report’ is typically the default view for users – unless they have already created their own personal views.
The main configuration options are the same as above, and are found under ‘Configure Reporter Settings’.
Simply make the required changes, saving your work as you move through the various options.
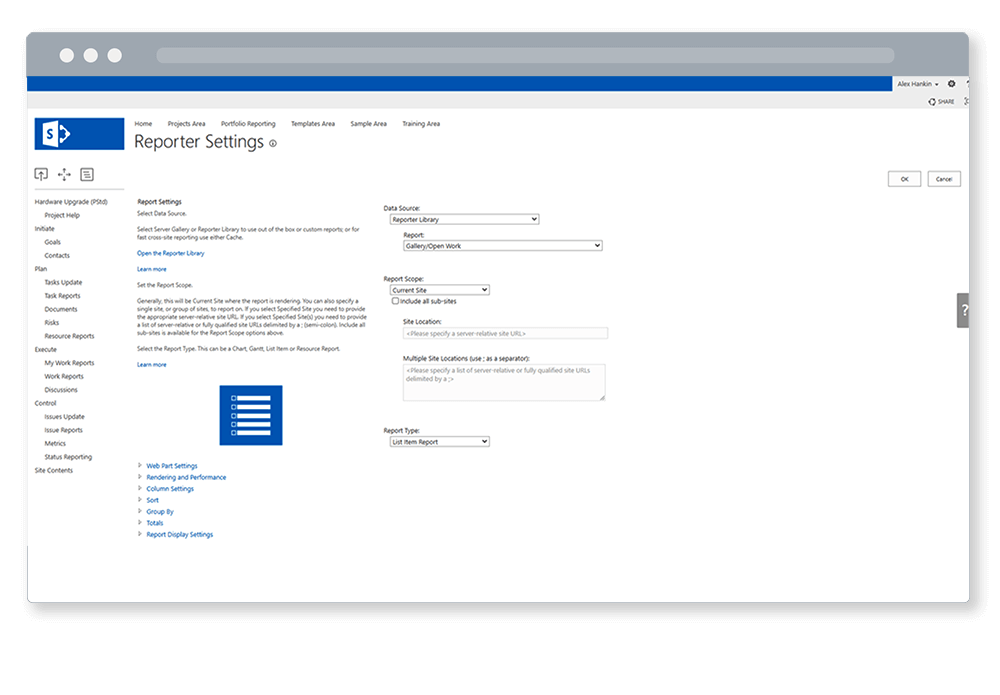
If you want to make more advanced changes, click ‘Configure Reporter Settings’ and access options such as:
- Data Source
- Report Scope (current or specified site)
- Report Type (chart, list, Gantt, or Resources Report).
