Did you know that the Project Cache is a feature unique to BrightWork and it is not found in the standard SharePoint solutions?
Webinar: Enhancing SharePoint Cross-Project Reporting with Power BI Dashboards
The Project Cache list is a rollup of all the data from the Project Statement, Project Metrics, and Project Trackers across the Site Collection.
It is primarily used to speed up performance on load times using the BrightWork Reporter tool. This means the query does not need to crawl all sites and can instead read from one central list.
Consolidating all Project Information into one list is an ideal data source for enterprise Power BI Dashboards.
Using Power BI to connect to the Project Cache to Set up Enterprise Reporting
To manipulate the data you need to use Power BI Desktop, available as a free download from Microsoft.
Once you have the desktop version installed:
- Launch Power BI Desktop.
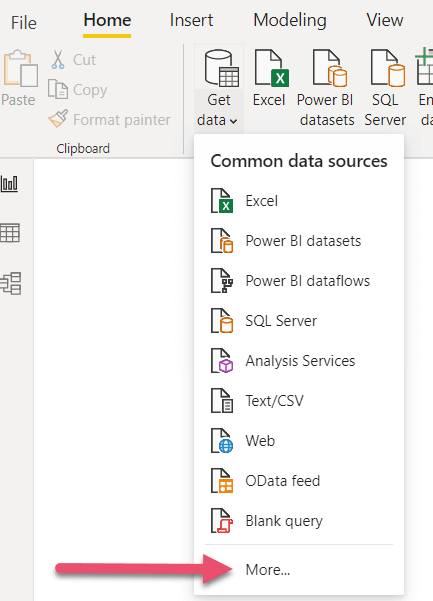
- Click on the Home Ribbon – Get Data.
- Click on More.
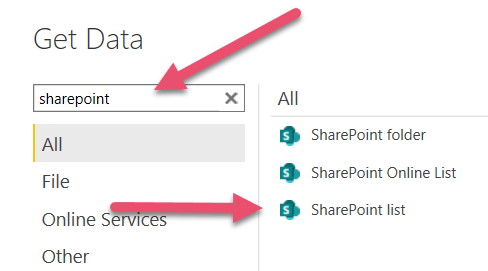
- Search for SharePoint.
- Click Connect.
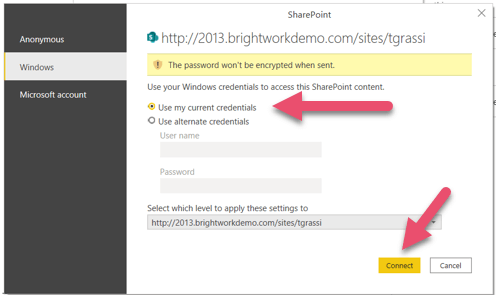
- Enter the name of the site collection you want to report on e.g. http://<servername>/sites/mysitecollection

- Click Ok.
- If prompted enter your login credentials on the Windows Page and click Connect.
- Once connected, select the checkbox next to the “Project Cache” list from the Navigation.
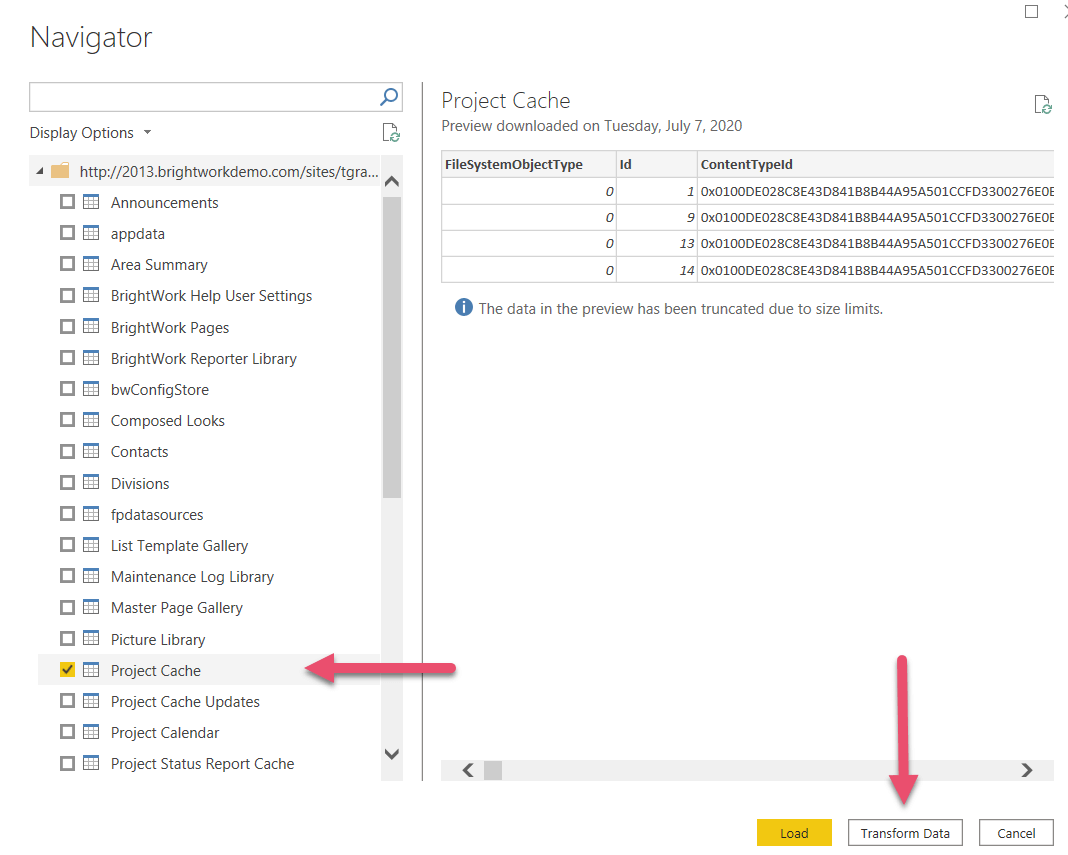
- Click on Transform Data.
- This will pull up the entire list in a table. Check the column types to make sure they are on the right data type. Note that the names for the columns are the field internal names. These can be renamed to the display names if needed.
- The columns typically appear as text. If you want to show a percentage or the date only you will need to update the field type. In this example, we’ll change the date/time field to date. Click on the ABC123 next to the field name to access a dropdown. Here, you can change the field type to show the date.
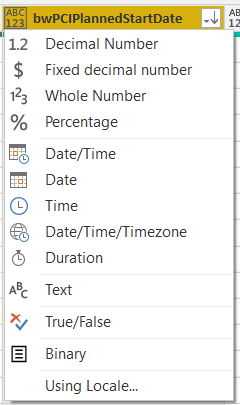
- When finished click in the Ribbon on the Home tab to “Close and Apply”. This will commit the changes in the report. NOTE: This will not change the column data in BrightWork.
- On the right-hand side of the Power BI menu, you will see all the columns that can be pulled in and reported on; configure and query data, and create real-time dashboards with other enterprise solutions. Below is an example of enterprise reports using SharePoint and BrightWork.
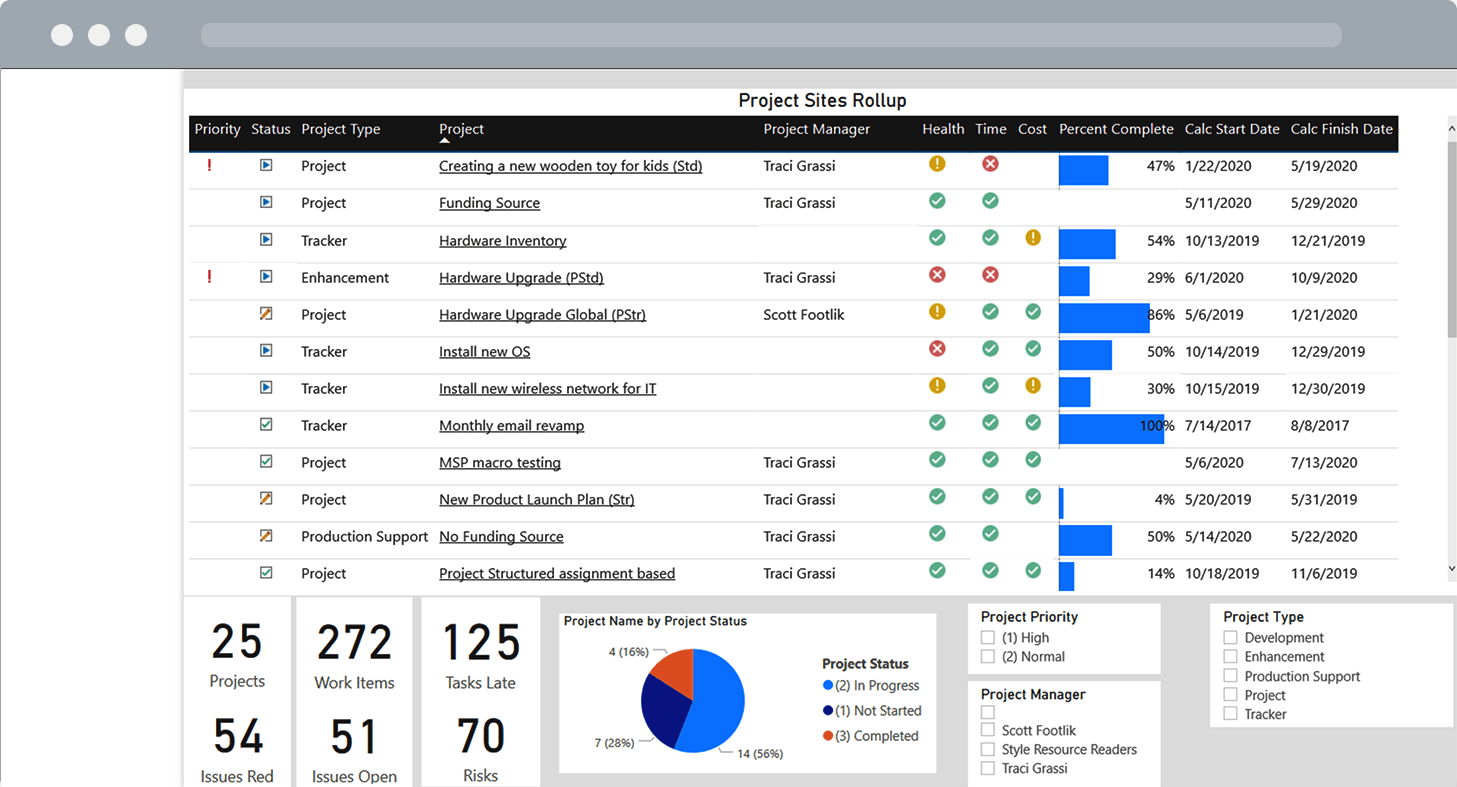
BrightWork Power BI Pack
Simplify project reporting with the BrightWork Power BI pack for SharePoint On-Premises.
The pack connects to the three BrightWork project data sources – Project Cache, Work Cache, and Project Status Report Cache – for complete insight into projects and portfolios.
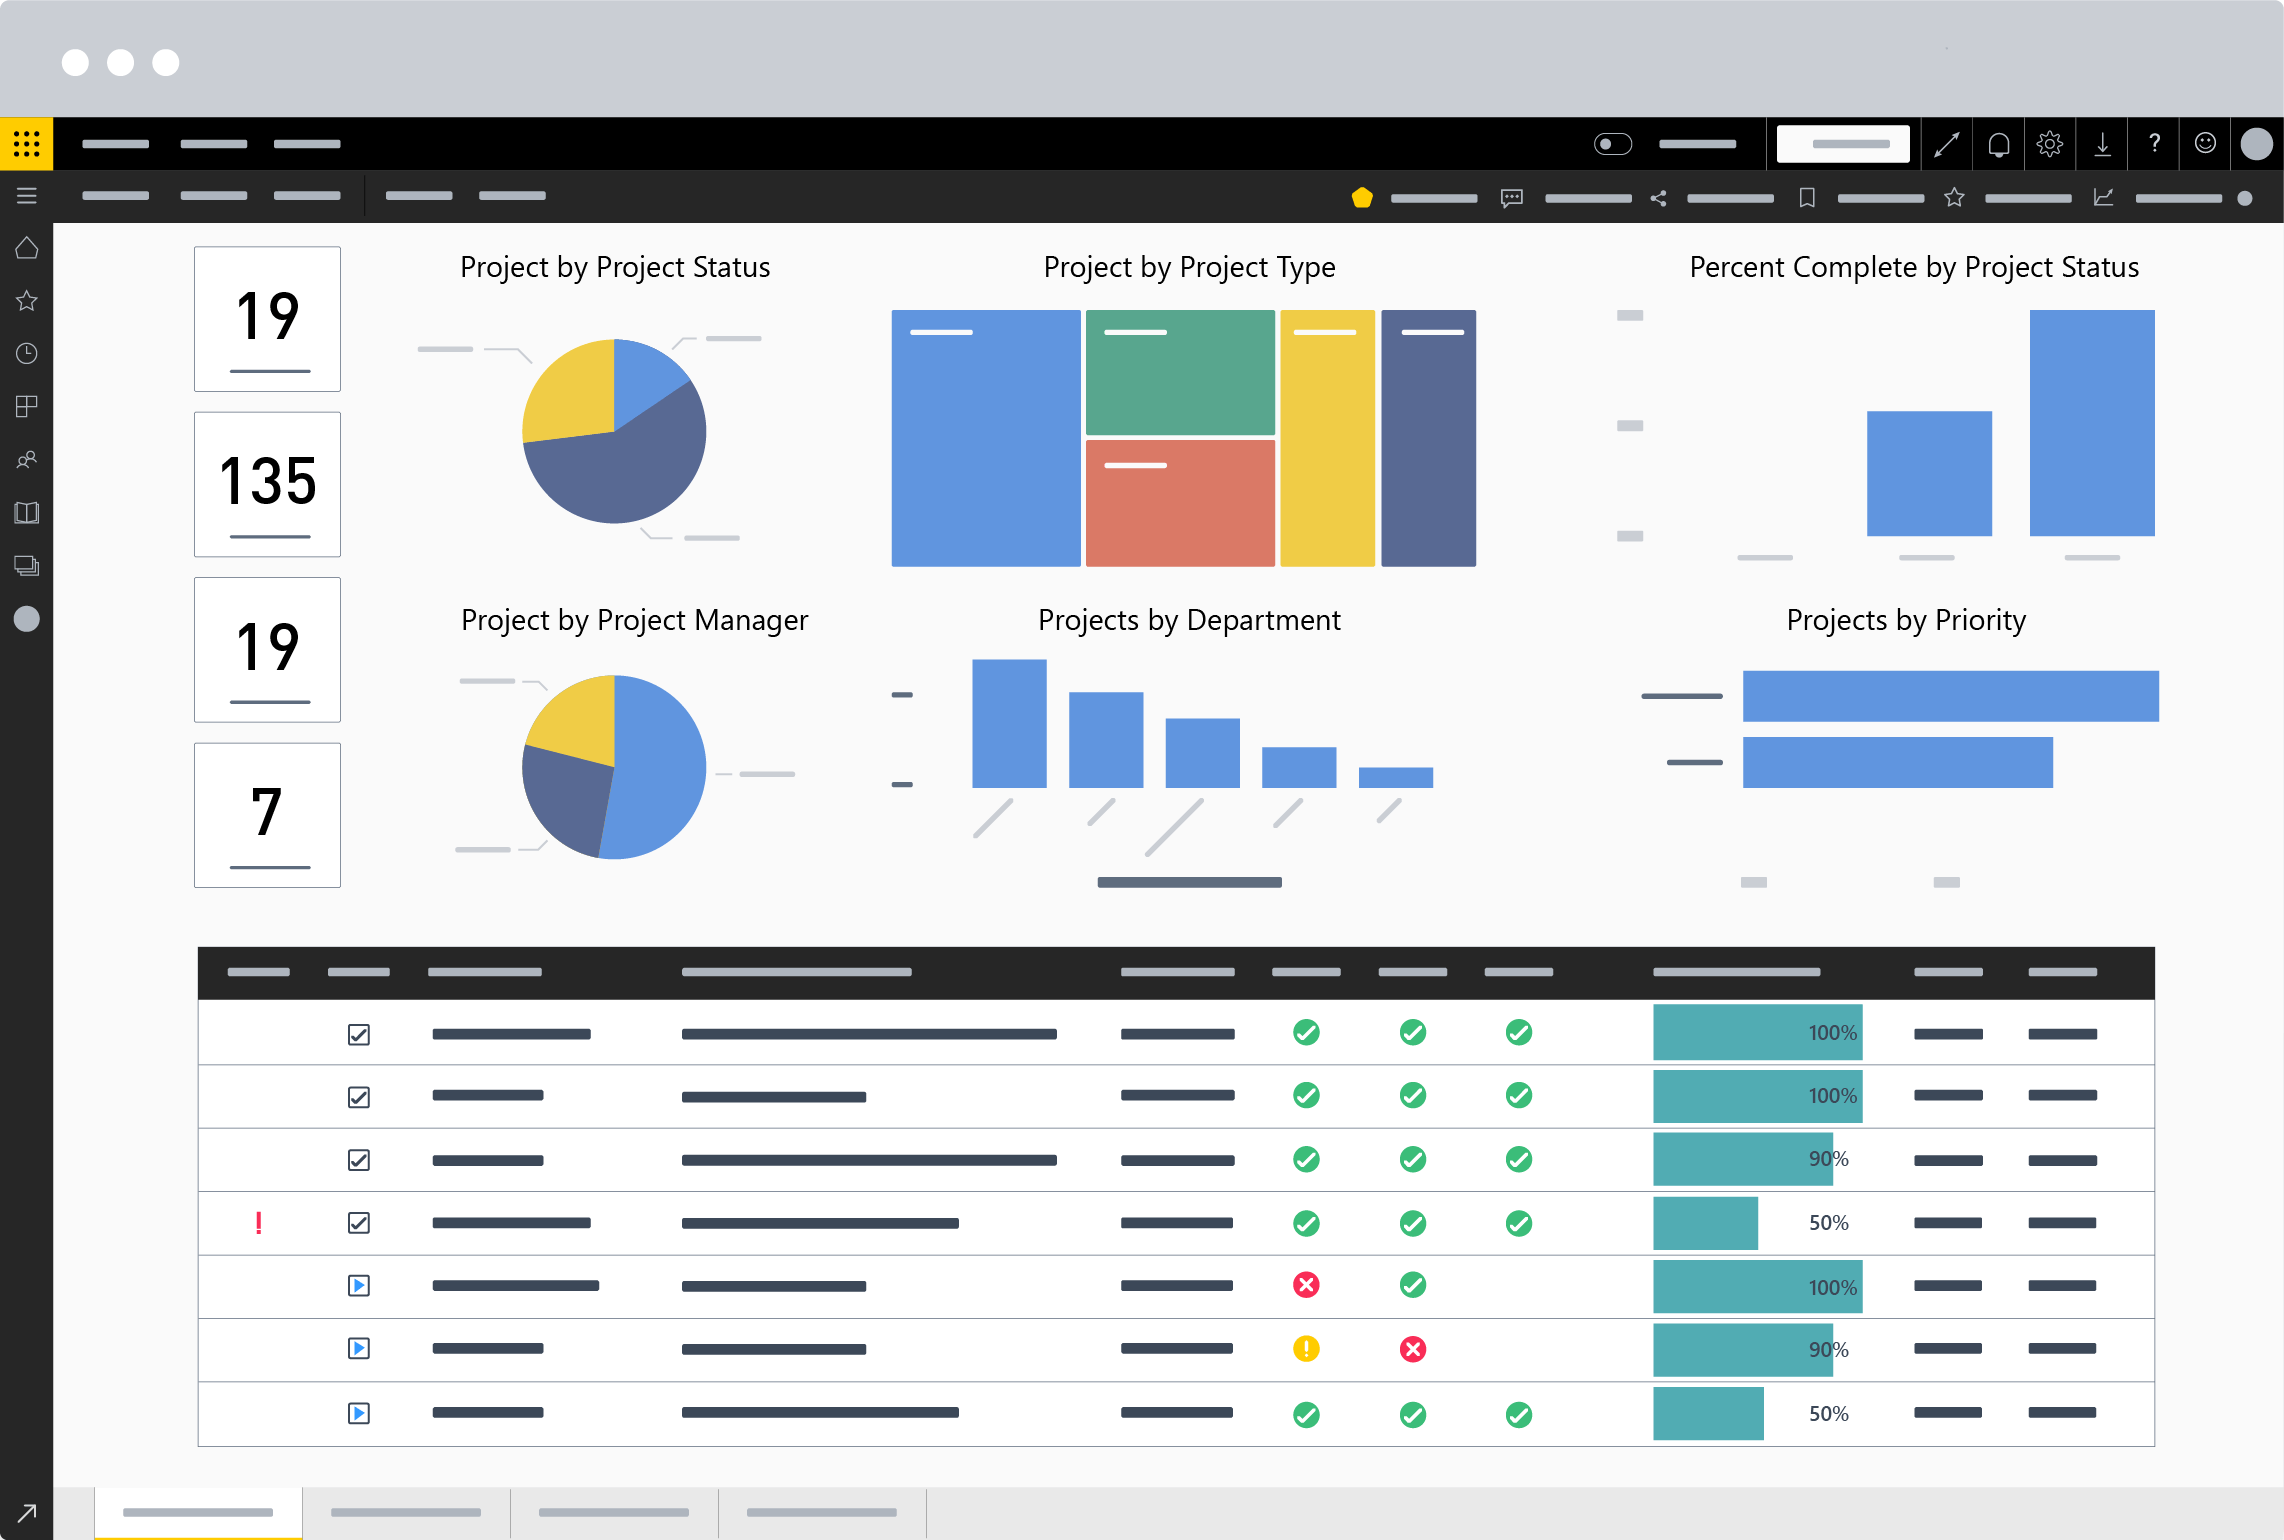
Available to BrightWork customers, the Power BI pack is a pre-built report with six dashboards:
- Portfolio dashboards with a roll-up summary of all project sites. The dashboard offers four filtering options: “Project Status,” “By Project Manager,” “By Project type,” “By Department,” and “By Priority.
- Portfolio timeline, a Gantt view of all project sites. Drill down by year, quarter, month, week, and day.
- Project and Task Timeline, a Gantt view of projects and tasks. Filter by project name, project type, project manager, and task owner.
- Work Reports allow project managers to check the status of tasks, risks, issues, and goals.
- The Status Report Dashboard includes RAG indicators, weekly updates, highlights, lowlights, and next steps.
- The Issue Report helps project managers to get further information on issues, including the task-owner.
Our Power BI consultants will work closely with you to configure your Power BI environment to create powerful interactive dashboards using your enterprise data.
If you’d like to learn more about using BrightWork and Power BI for project reporting, please contact us for more information.
