Project Risks can be defined as potential future events or conditions that can have negative effects on the outcome of a project.
Webinar: 3 Simple Steps for Managing Project Risks in SharePoint
Risk management is the processes and procedures that enable managers to identify risks, assess them, and plan a response strategy. Therefore you should consider risk management if you are managing projects on SharePoint.
Risk management is a proactive discipline. The practice helps project managers anticipate where a process may fail throughout the lifecycle of the project. If a project manager says a task will take three weeks, but the resources who are assigned to it say it will take six weeks, the proactive manager will create a project risk in the project and then follow the pre-defined risk management process. The consequences of not managing the risk and just wait until a problem occurs before doing anything would cause the project schedule to slip.
Risk Management Process
Risk management is appropriate for nearly all projects. The extent to which it is applied will vary from project to project depending upon the size and complexity of the project, the level of uncertainty associated with it, and how high the stakes are. The project risk management process would normally follow these steps:
- Plan Risk Management
- Identify Risks
- Perform Qualitative Risk Analysis
- Perform Quantitative Risk Analysis
- Plan Risk Response
- Monitor and Control Risks.
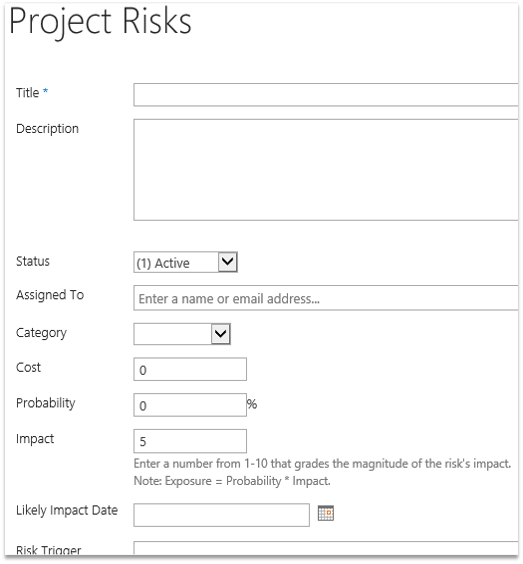
SharePoint Form
Designing a risk management app in SharePoint is quite straightforward and could be leveraged from an existing app from the SharePoint app gallery (e.g. Issues). The most commonly used fields to be defined in the form would include:
- Risk Title
- Status
- Type
- Probability
- Impact
- Exposure
- Response Strategy
- Owner
- Deadline.

Risk intake in SharePoint
Calculations
Measuring a risk requires combining the probability of an event occurring and the significance of the consequence of the event if it occurs. Scoring and interpreting the overall exposure of a risk can simply be multiplying the impact of the risk by its probability.
Reporting on Project Risks
Risk probability and impact can be represented in a matrix often referred to a heat map (see below). Using this graphical chart, project managers can perform qualitative risk analysis and then provide a risk response strategy accordingly. Creating this chart in SharePoint is not as complex as you might imagine and I found another blog post that details the steps here.

