A milestone marks an important point on your project plan, for example, the completion of the first phase of software development. A milestone represents a key achievement on the path to the project deliverables.
Watch: Improve Project Performance with Metrics and KPIs in SharePoint
Milestones are typically presented as a task with zero duration on a Gantt chart.
Whilst a milestone is the culmination of multiple tasks, tracking milestones helps teams to focus on the bigger picture. By reporting on tasks only, it’s easy to miss slippage in your schedule.
When tracking project progress, using a visual tool like ‘Milestone Trend Analysis’ (MTA) to check if tasks are on schedule or late, and how this impacts on delivering the next milestone is very helpful.
Once a potential risk to a milestone is identified, you can take the necessary steps to the project back on track. Here’s how to track project milestones with SharePoint.
Tracking Project Milestones on SharePoint
When managing Projects on SharePoint, this report could provide valuable context to your dashboard and is used in this way by Siemens Healthineers.
Using standard SharePoint features, a log is built in the background of your Project using a SharePoint Designer Workflow and is then plotted into a Chart using SharePoint’s Charting component available on SharePoint Server.
Workflow
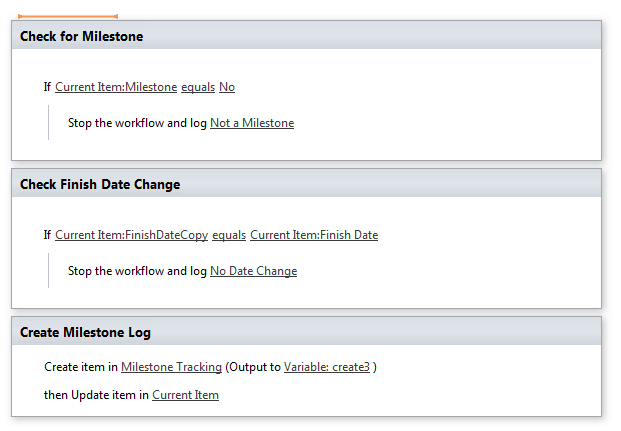
The main mechanism is building a log using a SharePoint Designer Workflow running on the Project Tasks list, using a standard Condition and corresponding Action.
Condition
Project Milestone Finish Date Changes.
- Run the Workflow on a Project Tasks list
- Trigger the Workflow to run every time an item changes
- Stop the Workflow if the item is not a Milestone
- Stop the Workflow if the finish date has not changed.
Action
Write the Milestone details to a log.
- Create a new list item in the Milestone Tracking log
- Copy over the Milestone Title and Finish Date.
Below is a screenshot of the SharePoint Designer Workflow:

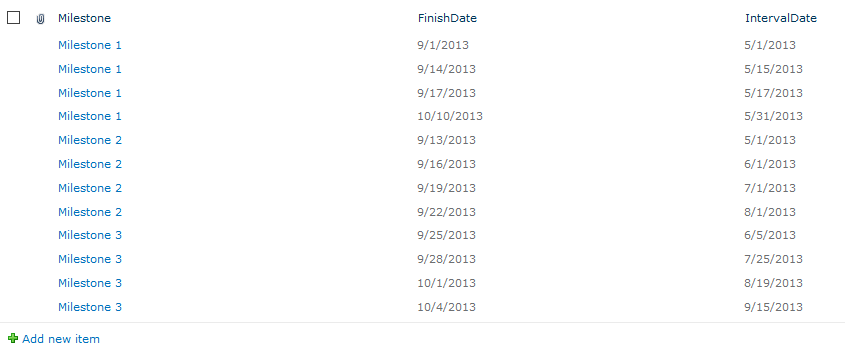
Milestone Log
The Workflow will write to a log in the background so Team Members won’t see it (unless they link to All Site Content). The log is quite simple because all we need is the name of the milestone, it’s finish date and when the finish date changed. Below is a screenshot of the log:

Charting
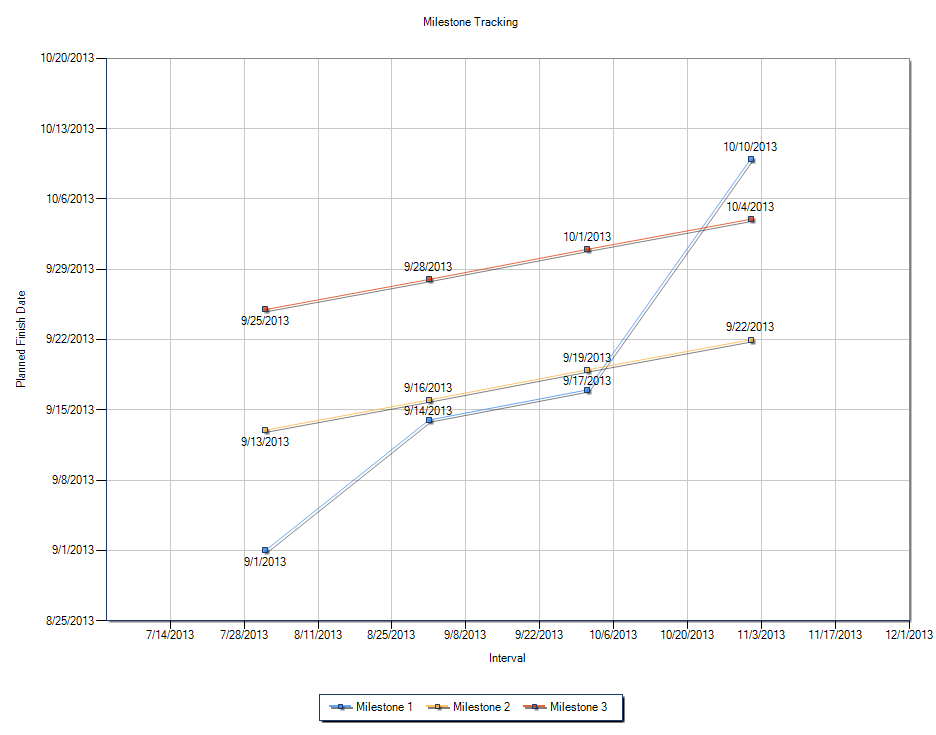
Finally, once the log is built, you can use SharePoint’s Charting features to graphically display a line chart which is fed from the log. The example below shows three milestones in the Project and we see a small level of slippage for Milestones 2 & 3. However, Milestone 1 has seen a relatively large slippage.

Editor’s Note: This post was originally published in December 2013 and has been updated for freshness, accuracy, and comprehensiveness.
